
Milk per cow has continued to increase. Since the beginning of 2018 through September of 2021, monthly milk per cow has increased by 3.9 percent in the U.S. In 2021, the most recent 12-month average increase is 1.1 percent. The April 2020 post to this blog has a chart of milk per cow dating back to 2014. Milk per cow was growing by just under one percent per year during the six-year span in that blog. While the overall U.S. growth rate in milk per cow consistently averages around one percent, the variances by state are very different.
Chart I is the 12-month average milk per cow from 2018 through September 2021. While there have been dips, there is a consistent increase over time.
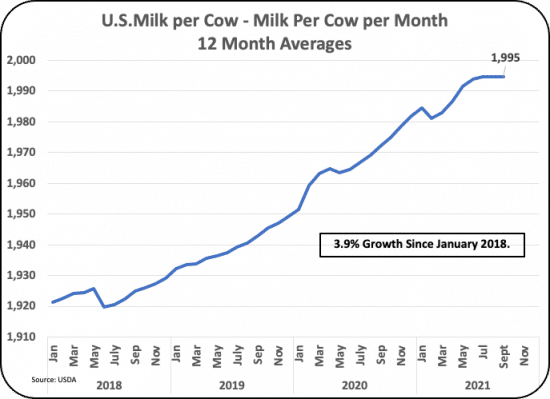
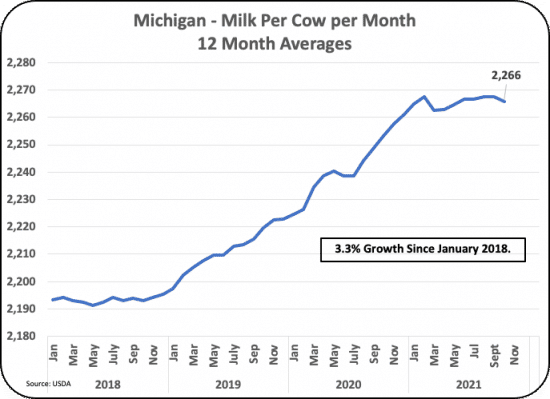
Chart II covers the 24 largest milk producing states ordered by highest to lowest in milk per cow. The difference is dramatic. Monthly milk per cow by state varies from 1685 to 2266 pounds per month. Cows in Michigan are producing 34 percent more milk than the cows in Florida.
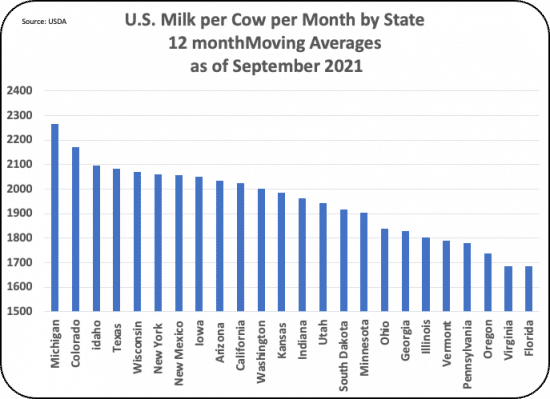
Table I below shows the 2021 milk per cow for the five states with the highest milk per cow. The five states are all well above the U.S. average with Michigan well above all other states.
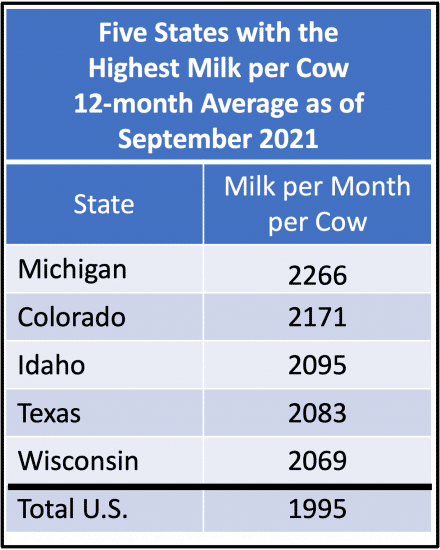
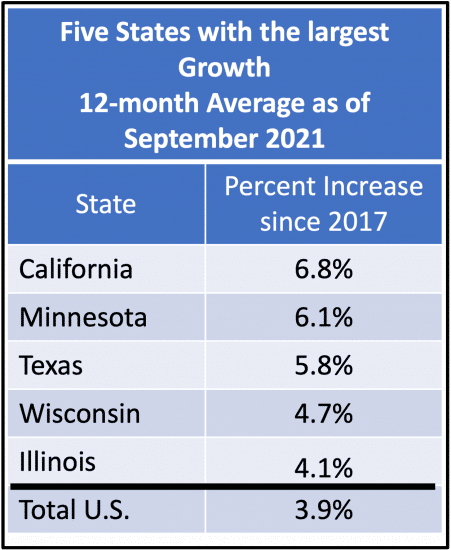
Table II lists the top five states in growth of milk per cow. By comparison, there were five states with negative or no growth in milk per cow. The data in this section measures the increases from the end of 2017 to September 2021.
The six major dairy producing states with the fastest growth in milk per cow are shown in Charts III to VI below.
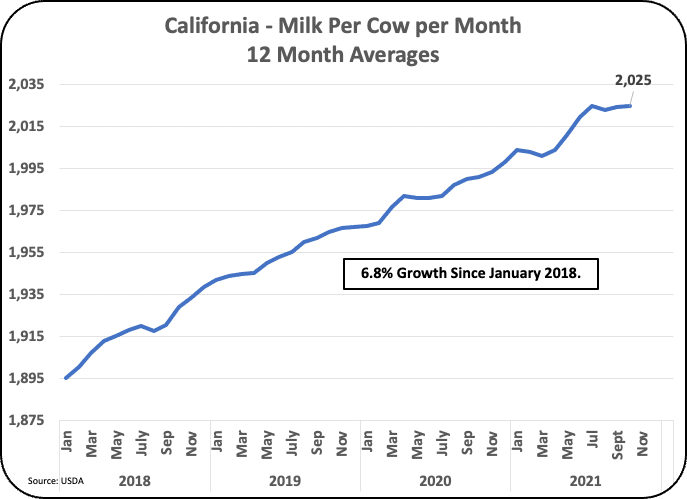
California is the growth leader in milk per cow. Chart VIII compares the 12-month averages from the end of 2017 to September 2021. During this time California increased milk per cow by 6.8 percent.
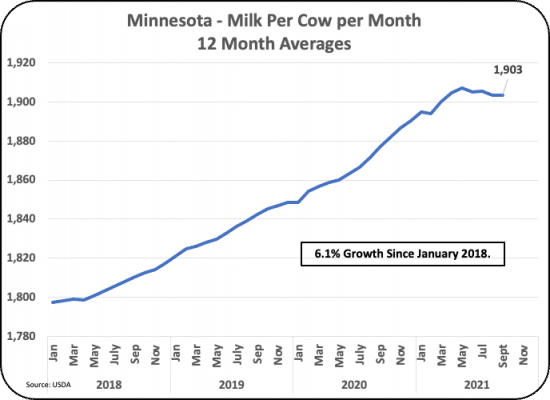
Minnesota ranked second in Table II with a 6.1 percent growth over the span of this analysis.
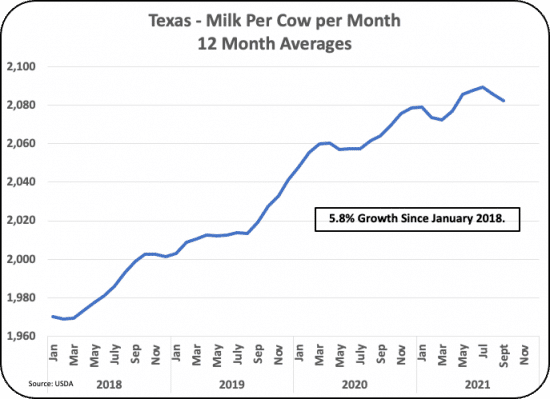
Texas, Chart IV, has also seen significant growth in milk per cow. The increases were not as consistent as California or Minnesota, but the results in total were close with a 5.8 percent growth. Texas has been ranked in the top five in terms of other statistics like the growing number of cows in the state. The Southwest Federal Order which includes Texas and New Mexico were ranked high in component levels for butterfat and milk protein.
Wisconsin, which is listed in Table I and Table II, is one of the five highest producing states in milk per cow and is also one of the top five in growth of milk per cow. Wisconsin is growing by 4.7 percent.
Source: Dairy Business


