
After more than twenty years with the Lifetime Profit Index (LPI) as Canada’s national genetic selection index, Canadian Dairy Network (CDN) has decided to adjust the scale of expression for all dairy breeds in conjunction with the April 2013 genetic evaluation release.
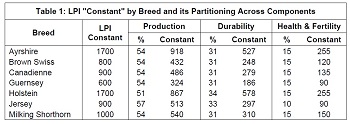
The CDN Board of Directors took this action following more than a year of consultation with the various breed associations and industry partners. The April 2013 implementation of the revised LPI scale of expression also includes an update of the standard deviation values for fat and protein yields in the formula in addition to the annual genetic base adjustments. New LPI Scale Since its beginning in 1991, the Lifetime Profit Index (LPI) has helped breeders and A.I. organizations rank bulls, cows and heifers to optimize selection and mating decisions, which translates to high rates of genetic progress for traits of importance. Effective April 2013, the scale for LPI values in each dairy breed will be half of what it has been. In order to maintain the level of LPI for the highest progeny proven bulls, a “constant” will be added to the formula For the Holstein breed, the “constant” will be 1700 points as presented in Table 1, which includes all breeds. This change in scale has no impact on how animals in each breed rank although reducing the range will create more animals tied at some LPI values.
Why Change the LPI Scale?
Figure 1 graphically shows the impact of this change in the scale of expression for LPI in Holsteins. LPI values for progeny proven Holstein sires have exceeded the range from -3000 to +3000 points in recent years. This is expected when the scale has an average near zero and the standard deviation is approximately 750 LPI points since the most extreme values would normally be four standard deviations above and below the average (4 x 750 = 3000). This very wide range is unique to Canada and the national selection index in most countries is expressed on a much narrower scale. For example, compared to 750 LPI points in Canada, the standard deviation for TPI in the United States is 235 points and most European countries use a scale with a standard deviation of less than 100 points. Adding a “constant” in the formula establishes the average value among progeny proven sires. This concept is similar to the approach used in the TPI formula for years, which currently includes a constant value of 1832. The use of 1700 for Holsteins in April 2013 will translate to a higher “constant” once the genetic base in Canada is adjusted in April 2014, which will allow for a direct comparison of LPI values over time within each breed. 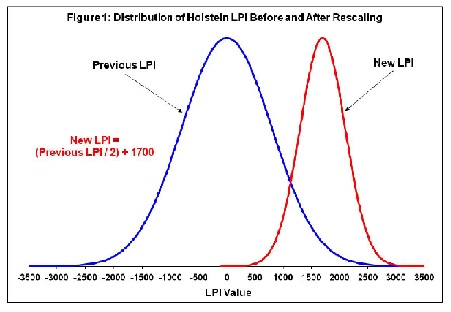
From a producer perspective, there is another major reason why CDN decided to halve the scale of LPI values in each breed while maintaining the level of the highest progeny proven sires. Such a change to the LPI scale of expression essentially eliminates negative values, which has been a major concern expressed by breeders regarding LPI values for older cows in their herd that have been very profitable during their lifetime. At the other end of the scale, the new LPI scale will reduce the perceived superiority of genomic young sires compared to progeny proven bulls as well as the top heifers compared to elite cows.
Interpretation of LPI
LPI values do not have a specific unit of expression and the main purpose is to rank bulls, cows and heifers according to the genetic selection strategy in each breed. Animals with a higher LPI are expected to produce progeny that will be more profitable over their lifetime, relative to lower ranking animals. This concept of superiority remains unchanged with the new scale of expression for LPI values in Canada. Based on a CDN study for Holsteins conducted in 2006, every 100-point difference in the average LPI at the herd level translated to an increase of $50 in profit per cow per year, which accumulates from year to year. With the new LPI scale effective April 2013, this result makes interpretation even easier for Holsteins. Every point increase in the average LPI of a herd now translates to a parallel increase of one dollar profit per cow per year for the lifetime of the daughter.
Updating Production Standard Deviations
Within the LPI formula, the genetic evaluations for each trait must first be adjusted to a common scale of expression. This is achieved by dividing the evaluations for each trait by the appropriate standard deviation, which makes the evaluations for all traits directly comparable and ensures the desired weight is applied to each trait included in the formula. Over the course of time, CDN geneticists have seen a change in the standard deviation of production proofs within each breed. The rescaling of LPI values in each breed also provides CDN with the opportunity to update the standard deviations for production traits, as presented in Table 2. Other than Milk Yield, the revised standard deviations for these traits affect the LPI formula in each breed. 
Summary
Effective April 2013, the scale for expressing LPI values in each breed is halved compared to the previous range. Top progeny proven sires maintain their LPI level while the highest young genomic bulls and heifers experience some reduction. Older cows with negative LPI values move up such that essentially all animals in each breed receive positive LPI values. Previous studies relating LPI to profit of daughters remain relevant with the new LPI scale of expression until CDN conducts an updated analysis in the near future.


