
To simplify understanding and maintain consistency among proof expression, several years ago Canada decided to express functional traits in the form of Relative Breeding Values.
What is a Relative Breeding Value?
A Relative Breeding Value (RBV) is a genetic prediction, just like any other breeding value you see on pedigrees, A.I. proof sheets, CDN’s website, or elsewhere. However, an RBV differs in that it has been standardized to a certain scale. In Canada, RBVs for functional traits have been standardized so the average is always 100 for proven sires born in the most recent ten years. Using the trait Herd Life as an example, average bulls in the breed for Herd Life will have a RBV of 100 for that trait. Bulls that are worse than average for Herd Life will have an RBV lower than 100 while above-average bulls for Herd Life will have an RBV above 100. This proof expression is similar to the scale used for type traits, except there the breed average is zero instead of 100.
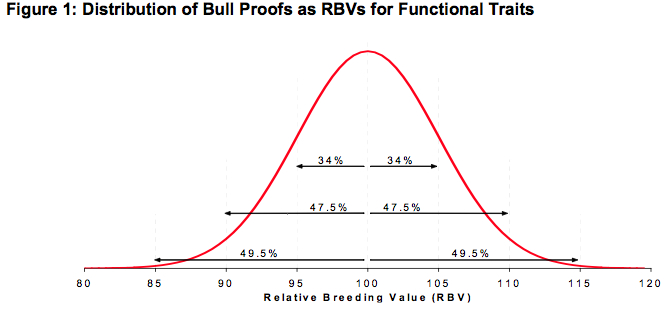
In addition to having an average of 100, RBVs have a standard deviation of 5, which is consistent with the variation observed for type traits. The distribution of bull proofs as RBVs can be seen in Figure 1 below. For any given functional trait, a standard deviation of 5 means:
- 68% of all bulls will have a rating between 95 and 105
- 27% of all bulls will have a rating of 90-95 or 105-110
- 4% of all bulls will have a rating of 85-90 or 110-115 and
- 1% of all bulls will have a rating below 85 or above 115
In other words, you could say only 2.5% of bulls have a RBV of 110 or greater for any given trait. In Canada, functional traits are expressed as RBVs to simplify understanding. Using RBVs, producers always know the average bull will have a rating of 100, and they are able to easily identify standout bulls for certain traits.
Translating RBVs into Expected Daughter Performance
Sire RBVs for functional traits can be expressed in terms of expected daughter performance. Table 1 shows the expected average daughter performance associated with an increase of 5 RBV points for various functional traits. For example, you can expect daughters of a bull with a RBV of 105 for Daughter Fertility to have 4 fewer days open compared to daughters of a bull with a Daughter Fertility of 100. This equivalence of 4 days open and 5 RBV points is consistent across the entire proof scale from 85 (poorest bulls) to 115 (best bulls). In addition, Daughter Fertility evaluations can also be translated into expected gains for pregnancy rate. For example, assuming your herd’s pregnancy rate is 20%, you’d expect daughters of a bull rated 105 for Daughter Fertility to have a pregnancy rate of 21.3% (+1.3% for each increase of 5 RBV points), while the daughters of a bull with a Daughter Fertility of 95 would have a pregnancy rate of 18.7%.
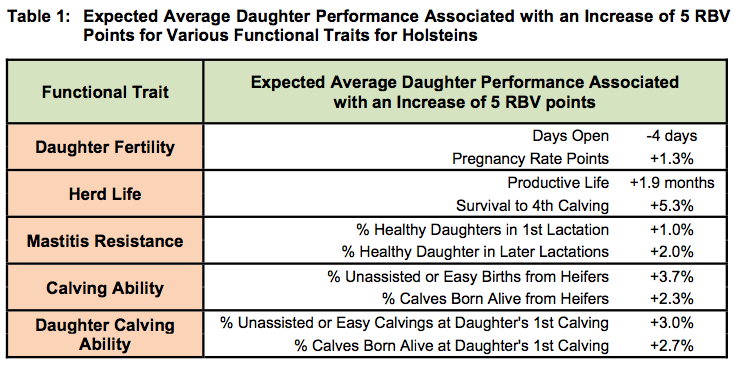
A more extreme difference can be seen when looking at bulls that differ by more than 5 RBV points for a given trait. For example, consider two bulls for Herd Life; one with a proof of 95 and the other with a proof of 110. Based on their sire alone, you’d expect daughters of the higher rated bull to have 5.7 (1.9 x 3 = 5.7) more months of productive life in the herd and 15.9% more daughters surviving to fourth calving compared to daughters of the lower rated bull.
In addition to Daughter Fertility and Herd Life, Table 1 also provides information for understanding the expected difference in average daughter performance associated with any increase of 5 RBV points for Mastitis Resistance, Calving Ability and Daughter Calving Ability. For each trait, producers can decided which measure of daughter performance is most meaningful for their herd improvement goals and genetic selection decisions.
Summary
To facilitate the understanding and use of the increasing amount of genetic information available for bulls, functional traits are expressed as Relative Breeding Values (RBV). While the use of such a standardized scale of proof expression helps to easily identify significant breed improvers for each trait, as well as the low end bulls to be used with caution, RBVs do not provide producers with a clear description of how much better one bull’s daughters will perform compared to daughters of other bulls. Luckily, however, differences in RBV values for each functional trait can be translated into associated differences in the expected average performance of daughters. For sake of simplicity, one need only to recall the equivalent change in average daughter performance associated with an increase of 5 RBV points and the subsequent interpretation is quite straightforward. The bottom line is that genetic evaluations aim to identify relative differences among sires and the use of RBVs also provides simple translation equivalents to further enhance the understanding and expectations of a bull’s daughters based on their proof for functional traits.
Authors: Lynsay Beavers, Industry Liaison Coordinator, CDN Brian Van Doormaal, General Manager, CDN

