
Genetic evaluations for functional traits are expressed as Relative Breeding Values (RBV), which provide a consistent and easy to understand scale. While the benefits of using RBVs are great, they do not provide producers with a clear description of how much better one bull’s daughters may perform compared to daughters of other sires. The expected improvement in daughter performance due to the selection of a bull with a 5-point higher RBV can vary greatly between traits – depending on the variation observed in the population and the trait heritability. Effective December 2021, Lactanet is introducing a new column of daughter performance interpretations for functional traits on the Genetic Evaluation Summary page for bulls to help translate RBV differences into expected daughter performance.
What is a Relative Breeding Value?
An RBV is a genetic evaluation that can be used like any other, but it has been standardized to a pre-defined scale. In Canada, RBV values for functional traits are standardized so that the average proven sire is set to 100 and a value greater than 100 is always favourable. In addition, RBV values have a standard deviation of 5, meaning that two-thirds of proven sires are expected to fall between 95 and 105 and essentially all bulls are within the range of 85 to 115 (±3 standard deviations). Using RBV for all functional traits allows producers to compare values for multiple traits using the same scale and easily identify elite sires that standout for each trait.
Translating RBV into Expected Daughter Performance
The actual phenotypic performance of a sire’s daughters is often displayed of the detail pages associated with various functional traits. Examples include the distribution of daughter milking speed scores and the percentage of daughters with no clinical case of mastitis in first lactation. However, these values do not account for the influence of herd management that these daughters are under, and are also not available for most bulls, including genomic young bulls. The relationship between sire RBV values and actual daughter performance can be examined using a large number a proven sires and the performance records of their daughters. Analysis of this data for proven sires provides a tool for predicting the expected average performance of daughters from sires depending on their RBV level. Bull RBV interpretations are expressed as a deviation from the expected performance of daughter of a breed average proven, which are therefore independent of herd management and the genetic level of the dam. For example, a Holstein sire with an RBV of 105 for Mastitis Resistance is expected to have 5.9% more daughters without any clinical mastitis compared to daughters of an average bull at 100, independent of whether the herd itself has a high or low mastitis incidence rate.
Interpretation Trait Definitions
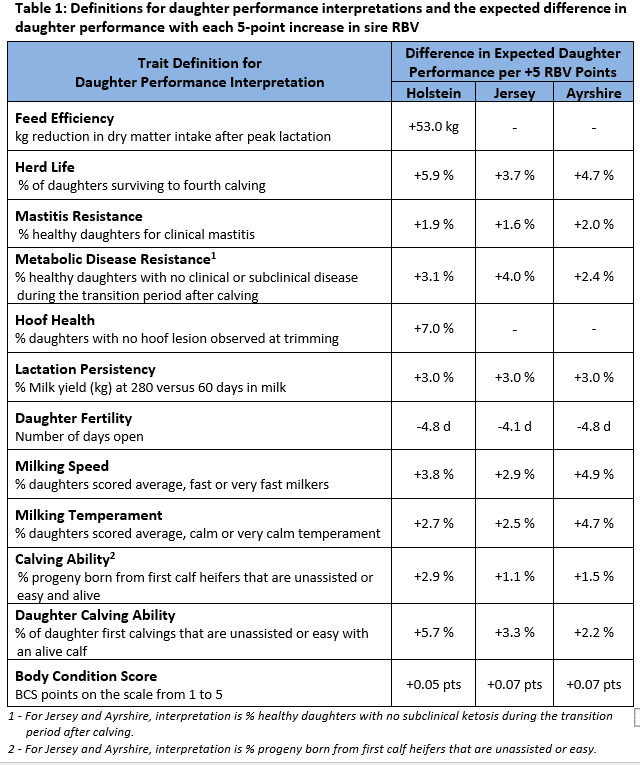
Functional traits listed on the Genetic Evaluation Summary page like Milking Speed, Milking Temperament and Body Condition Score are single traits while the remaining are all indexes combining several traits. These may be traits measured at different times in a cow’s life or describe a different disease or component of the overall index goal. An interpretive value displayed for each RBV needs to be a single measure of daughter performance that encompasses the main focus of each index as much as possible. Table 1 describes the definitions and respective interpretive values used for the each of the three breeds where this column will be available.
Example: Interpreting Hoof Health
Hoof Health is an index combining the genetic evaluations for several different hoof lesions with relative weightings that represent the frequency and economic value or each lesion. As such, two bulls could arrive at the same Hoof Health RBV even though they have quite different evaluations for the individual hoof lesion traits. For example, two sires may both have 105 RBV for Hoof Health but have different Digital Dermatitis evaluations of 99 and 110. We could relate Hoof Health to the expected proportion of daughters with no Digital Dermatitis and these 105 Hoof Health bulls would be expected to have on average 3.8% more daughters free from digital dermatitis. Knowing the different Digital Dermatitis proofs of these bulls, this is not the daughter performance we should really expect. The Hoof Health index describes all lesions together and therefore the proper interpretation is the percentage of daughters expected to be free of any lesion when presented to the trimmer. These 105 Hoof Health RBV bulls would therefore have an expected daughter performance of 7.0% more daughters without any lesion compared to a 100 RBV bull. To see how a bull’s daughters are expected to perform for individual hoof lesions, consult the Health details tab and scroll to the bottom to find the Hoof Health section.
Example: Interpreting Daughter Fertility
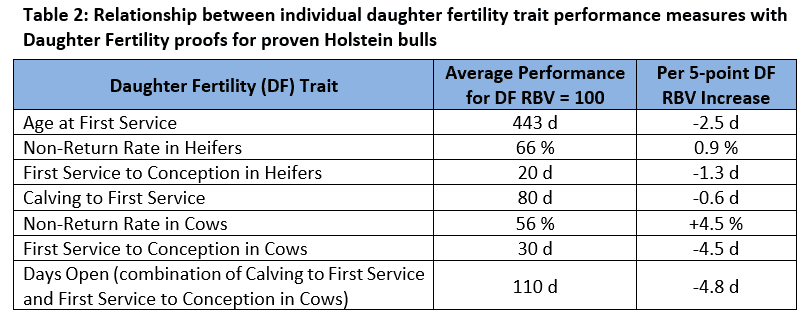
Daughter Fertility is an index which combines traits related to female fertility that have very different expressions and timings that cannot be jointly described in a single daughter performance measure for fertility. It is possible, however, to relate Daughter Fertility RBV values with actual daughter performance for each of the traits contributing to the index, as shown in Table 2 for the Holstein breed. The strength of this relationship differs between traits with the strongest being between Daughter Fertility and daughter performance for Non-Return Rate in cows and First Service to Conception in both heifers and cows. Considering the accuracy of the various possible interpretations and the primary objective of Daughter Fertility, Days Open was selected as the single value to present on the Genetic Evaluation Summary page for bulls. For each 5-point increase in sire RBV for Holsteins, the daughters are expected to have 4.8 fewer days open. For each of the Holstein, Jersey and Ayrshire breeds, the expected daughter performance will appear for each bull with the value being representative of their distinct RBV.
Look for the new Daughter Performance column added to the Genetic Evaluation Summary page of all Holstein, Ayrshire and Jersey bulls, effective December 2021. This tool is not available for other breeds due to the limited number of proven sires required for deriving the translation equations. The value presented give a quick and easily accessible way to see how the daughters of a particular bull are expected perform in your herd, on average, relative to daughters of a breed average sire with an RBV of 100. Start your bull search on the Lactanet website here.
Authors: Allison Fleming, Geneticist
Caeli Richardson, KTT Genetics Expert
Source: CDN
